Key Risk Indicators
Traditionally, Key Risk Indicators (KRI) are metrics used for detecting operational and financial risk categories and forecasting the likelihood of the risk occurring in the future and potential impacts. But now, it is practically impossible to predict or compute the value of risk probability, impact, inherent risk, control effectiveness and residual risks in all categories of risks without Key Risk Indicators (KRI). Examples of risk categories are the following:
- Technological risks
- Financial risks
- operational risks – people, ICT systems, policies, processes and procedures, hierarchical reporting structure
- Media and communications risks
- Corporate Culture risks – leadership and governance styles.
- strategic risks,
- market risks,
- reporting risks,
- HSEQ risks,
- Political risks
- social-economic risks
- Enviornmental risks
- Legal and regulatory compliance risks
Key Risk Indicators helps to provide hindsight (past information) on risks, insight (current information) about the current state of risks in the organization and foresight (future events that may happen). The hindsight, insight and foresight concept classified key risk indicators into two, namely: Lagging and Leading. Lagging Key Risk indicators are back-ward-looking focused on discovering problems that have occurred, domains affected and root causes using historic events data and looking at the trends. The actions taken to address the issues are strictly subject to the total number or value of the events that have happened compared to the established acceptable limit threshold. Examples, include number of accidents that have happened, number of revenue loss that have happened.
Leading Key Risk Indicators are focused on what will happen in the future by keeping track of the factors that can lead to potential problems happening in the future. Examples: number or percentage of staff not wearing or having safety boots and eyeglasses will lead to high probability of HSEQ risks occurring in the future. while number or percentage of dissatisfied customers will result in revenue shrinkage in the future.
The application of Key risk indicators in conducting risk assessments, monitoring and reporting is mandatory for all risk categories and requires good knowledge of the company’s risk appetite and tolerance levels. This is necessary because the threshold for the key risk indicators is defined in consideration to the company’s risk appetite and tolerance levels.
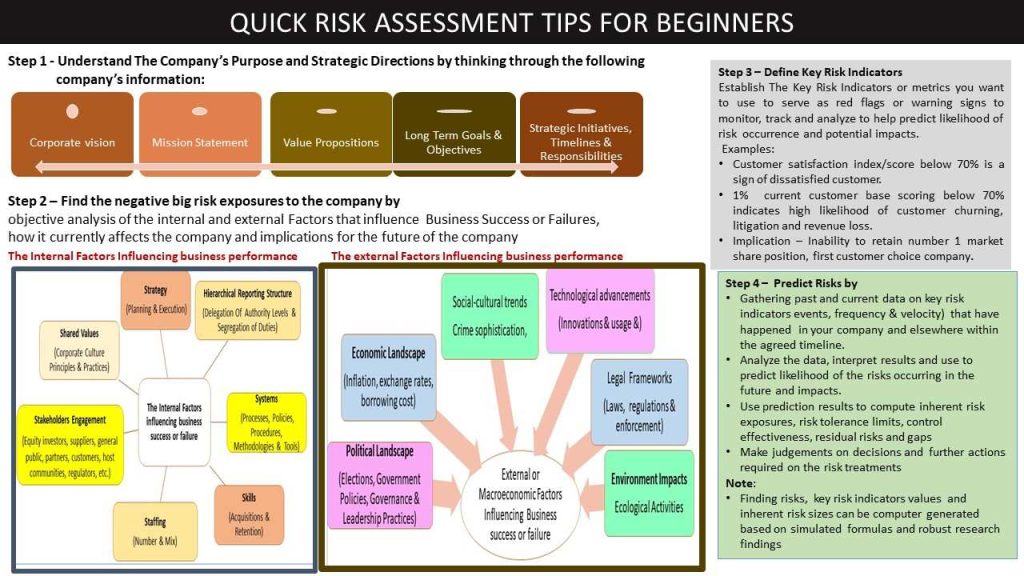
Application of Key Risk Indicators in real life situations requires taken five (5) key steps as follows:
- Step 1 – Understand the purpose and areas of coverage
- Step 2 – Define the parameters and benchmark values for the key risk indicators giving consideration to the company’s purpose, strategic directions, business and risks in focus, company’s appetite and tolerance limits and industry benchmarks.
- Step 3 – Metrics Data Collection. Collect the data events (leading or lagging metrics) based on a combination of many sources (past and currents real events) that have happened in the company, industry and external. The data events are captured as loss events or near misses with the description of the event type, frequency, velocity/speed, time of occurrence, where it occurred, root causes and impacts over a given timeline. Also to be captured are the actions that have been taken to address the issues, the response time, action completion time, responsibilities, associated costs and effects. Besides manual observations and collections of historic key risk indicator events, conditions or actions, statistical or scientific methods can be leveraged through automation and robust research findings to simulate the generation of the key risk indicators and usage to compute risk probability and impact. This is where Quantum AI becomes very handy.
- Step 4 – Analyse and interrogate the collected data events. The data captured are analyzed based on some factors to be determined by the company such as global leading practices benchmark index, special circumstances peculiar to the company, peoples’ knowledge and experience.
- Step 5 – Interpret data analysis results and link to the right risk categories and corporate goals and objective
- Step 6 – Develop Dashboard reports of the analysis reports and presented to the relevant authorities to make decisions and recommend the right choice of actions to be taken to proactively address the early warning signs to prevent escalation to uncontrollable state.
Monitoring the early warning signals to detect the circumstances requires use of lagging or leading metrics often expressed in ratios, trends and turnover and lead-time. These metrics have the industry benchmark values preset out of robust research outcomes by credible global research organizations or regulatory authorities.
- Ratio analysis assesses relationships between items by comparing the size of one time to the size of another time or the proportion of one item to be covered by another item.
- Trend analysis assesses the pattern of changes in one item overtime by comparing the value of an item in one period to the value of the same item in another period.
- Turnover assesses frequency of events indicating the efficiency or productive use of the asset.
- Lead-time assesses response speed or velocity between events.
The best to start learning how to establish key risk indicators is to learn the popular key risk indicators globally used in specific industries. A lot of these popular key risk indicators are available on the internet. The values serve as industry benchmarks which learners or users can tweak to fit into the special circumstances in their company. The robustness of a company’s key risk indicators and effective usage to addressing real life situations depend primarily on the corporate culture driven by competency levels, leadership style and people’s attitudes, behaviours and commitment to excellence.
For examples, there are many adverse events, conditions, intentional and unintentional actions that can cause financial instability of a company and ultimately the company’s liquidation. Such adverse events, conditions and actions include the following:
- a company’s inability to pay its debts (suppliers, lenders, etc.) due to incessant cashflow issues,
- When a company funds majority of its business operations with borrowed fund rather than fund from equity investors or shareholder
- When a company is not making profit on continuous basis.
- When an inventory product is slow moving.
- When supplier or customer service provision lead-time is high.
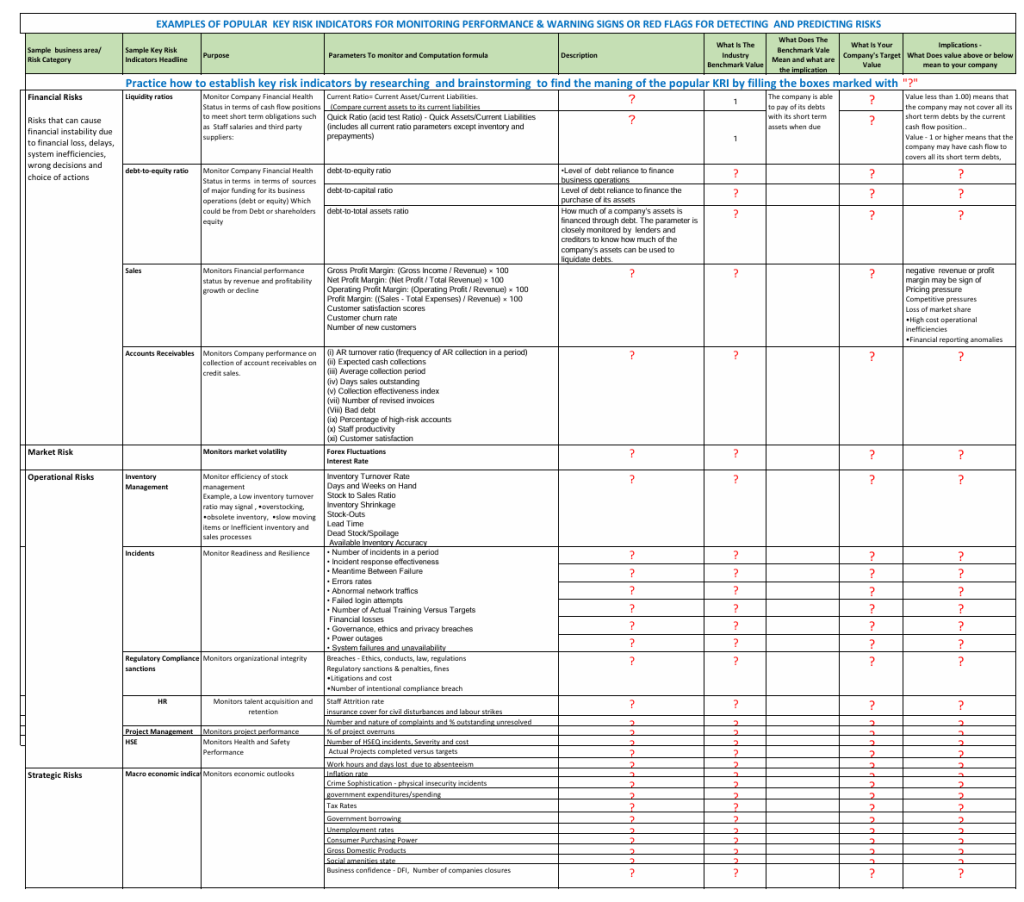
The popular key risk indicators globally used to monitor a company’s inability to pay its debt as at when due is liquidity ratio while Debt-to Equity ratio is the key risk indicator to monitor when a company depends on debt borrowing to finance majority of its operations rather than fund from equity investors. Profit Margin trends (period to period comparisons) is used to monitor the company’s consistency in making profits and financially growing while Sales turnover monitors the amount of money the company generates from the sale of its products and services over a given time period.
The industry benchmark values for the liquidity ratio, debt-to-equity ratio, and profit margin trends have been set based on robust research findings from credible organizations. For example, the industry benchmark for liquidity ratio and debt-to-equity ratio is 1.00. If a company’s actual computed liquidity ratio is less than 1.00, the implication is a warning sign or red flag that the company at that time will not be able to pay its debtor with its cash-flow. To pay the debt, the company may contemplate to sells its fixed assets or from lenders or raise additional fund from the shareholders which may be difficult to achieve or take longer time, thereby, putting the company into bad reputations, litigations from lenders or service providers, asset confiscation by the lenders or suppliers to recover their money or license withdrawal by the regulator for not adhering to laws and regulatory compliance requirements regard debt financial status and settlements.
Another example is when the company funds majority of its operations from borrowing. The implication is that or erratic interest rate fluctuations (market risks) due to stifling government policies will place the company in a very high disadvantaged positions to be paying high interest rates which may stifle the company’s operations, particularly when the company is not making good profit. This may eventually lead to the lenders recalling their money through litigations and confiscation of the company’s assets.
Presented below are some examples of the popular parameters used as Key Risk Indicators across the globe. Some of the boxes in the Key Risk Indicators template below have been intentionally left blank to inspire the beginners to research and brainstorm on the parameters and get them completed to reinforce their knowledge and experience to apply the lessons learnt in real life situations.